
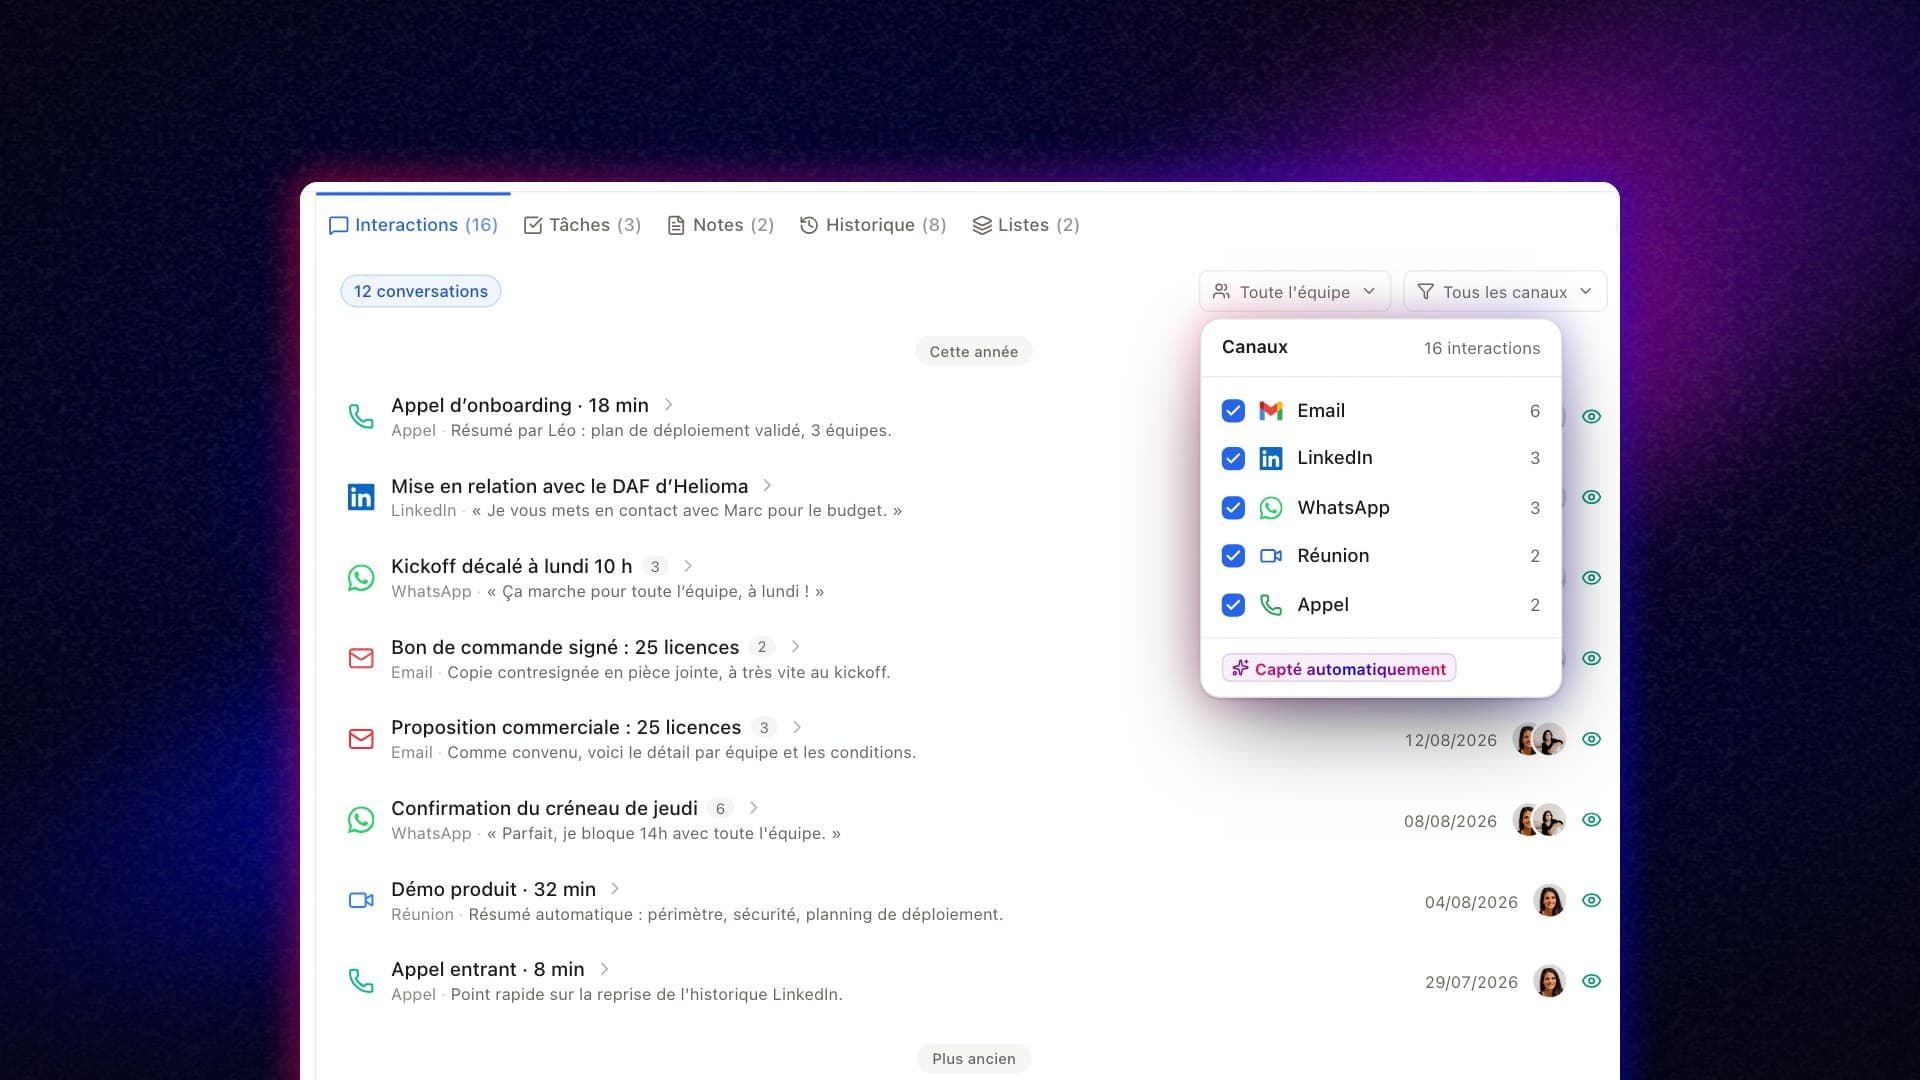
What your CRM never records: measuring your capture rate
 By Marceau· Kasar Team
The category has spent four years arguing from self-reported numbers that move twelve points between two editions of the same report. Capture rate works differently: one division, four conventions, computed on your own logs.
A completeness rate counts the fields filled in on the records a CRM already holds. It says nothing about the conversations that never reached it, and that is the question deciding what the tool is worth. It gets put to the reps, never to the machine.
Salesforce's State of Sales editions show what that way of asking produces. The fifth, published on 8 December 2022 with 7,775 sales professionals across 38 countries, puts the share of the week respondents say they spend selling at 28%. The seventh, published on 3 February 2026 with 4,050 professionals across 22 countries, puts it at 40%.
The useful number is built another way, and it fits in one division. Count the business conversations that actually took place over a period, count the ones your CRM holds attached to a record, divide. That is the capture rate: it is observed, not declared. No figure quoted here comes from an internal measurement: this piece publishes a protocol, not a result.
Three editions of one report, three numbers that do not compare
State of Sales is one of the most cited series in the category, and it is instructive for an unexpected reason: it moves. The sixth edition, surveyed in March and April 2024 with 5,500 professionals across 27 countries, records 70% of a rep's time going to work other than selling, so 30% spent selling.
The seventh, surveyed in August and September 2025 and published on 3 February 2026, lifts that share to 40%. It adds that Gen Z reps sit at 35%, and that they lose roughly two hours a week to manual data entry.
Lined up, the three editions read 28% in 2022, 30% in 2024, 40% in 2026. A twelve point swing in four years may signal real progress. It may also signal that the panel changed: 7,775 respondents across 38 countries at the start, 4,050 across 22 countries at the end. Salesforce never claims to hold the panel constant from one edition to the next.
Reading those three numbers as a trend line is therefore a misuse, and the category commits it every time it quotes them. A self-reported figure, once published, comes loose from its survey: it travels without its panel, without its fieldwork dates, without its definition of selling time. And it shares the property that disqualifies all of them here. It describes declared time, it counts no interaction.
Why a self-reported survey cannot measure an omission
The limit is not respondent honesty, it is structural. The meta-analysis by Douglas Parry and co-authors, published in Nature Human Behaviour in 2021 and based on 106 effect sizes, concludes that self-reported digital media use correlates only moderately with logged measurements, and that self-reports rarely reflect logged use accurately.
The mechanism fits in a sentence: you do not remember a conversation you never recorded. The omission is precisely the event the respondent cannot report. A self-reported survey therefore measures a feeling of administrative load, never a missing volume.
The scale of the flow itself is measurable by telemetry. Microsoft's report Breaking down the infinite workday, published on 17 June 2025 from Microsoft 365 usage signals and a survey of 31,000 workers across 31 markets run between 6 February and 24 March 2025, records 117 emails received a day and 153 Teams messages per weekday.
It also puts a number on interruption: one every two minutes during working hours, 275 times a day. Asking someone interrupted 275 times a day what share of their conversations they logged is asking them to count what they never noticed. So the measurement has to change its object. It looks at logs, not at memory.
A CRM is not judged by how complete its records look. It is judged by the gap between the conversations that happened and the ones it kept.
Capture rate, a definition that fits in one division
Capture rate is the ratio between the number of business interactions present in the CRM and attached to a record, and the number of business interactions observable over the same period and the same scope. It is expressed as a percentage, computed per team, per channel and per month, and it means nothing unless four conventions are written down before the first query.
Four conventions to fix before you count
- The unit. One message sent or received, one connected call above a threshold set in advance, one meeting that took place. A thread is not a unit, otherwise a forty message negotiation weighs the same as a read receipt.
- Deduplication. One email addressed to three people at the same account is one interaction, not three. Without that rule the numerator swells with the size of your distribution lists.
- Attachment. An interaction that is stored but linked to no contact and no company does not count. It sits in the database, it is not in the CRM in any useful sense.
- Latency. An interaction logged forty days after the fact is not worth a trace available the next morning. Publish the median logging delay next to the rate, or the two get confused.
The numerator is the easy half: it comes out of an export. The denominator is the actual work, and how hard it proves to build is the first finding of the exercise. A team that cannot reconstruct the volume of exchanges on a channel has just learned something useful about that channel.
The denominator moved channels, and finance paid to find out
A denominator built on corporate email alone describes a world that no longer exists. Meta announced on 27 June 2023 that its WhatsApp Business app had passed 200 million monthly active users, up from 50 million in 2020. The channel quadrupled in three years without ever touching a corporate server.
Financial services priced that shift the hard way. On 27 September 2022 the US Securities and Exchange Commission announced more than $1.1 billion in penalties against sixteen firms, fifteen of them broker-dealers, for business conversations held between January 2018 and September 2021 on personal messaging apps that were never preserved. The same day the CFTC announced $710 million more against eleven institutions whose staff had used WhatsApp and Signal.
The consequence for measurement is mechanical and counterintuitive. A CRM wired to the inbox alone posts an excellent capture rate, because it reports a high share of an amputated denominator. The narrower the observed scope, the more flattering the result. Read the scope before the number, every time.
Widening the denominator means observing the channels where the conversation actually happens. Kasar documents its coverage at kasar.app/integrations/whatsapp and kasar.app/integrations/linkedin, as other vendors document theirs, and the comparison is made page against page. It is also the point where measurement turns into a legal and managerial question.
What the number does not say, and what it must never be used for
A capture rate says nothing about the quality of what was captured. A record can hold every message and not one usable summary. It says nothing about commercial value either: logging every exchange on a lost account earns nothing.
Aggregated to the individual and named, it stops being a measurement and becomes a control instrument. The data minimization principle in article 5 of the General Data Protection Regulation requires processed data to be adequate, relevant and limited to what is necessary for the stated purpose. A purpose phrased as understanding what the CRM does not see is satisfied by an aggregate per team and per channel.
What a capture number must carry to be citable
- The exact period, and the number of teams or organizations observed.
- The definition of an interaction used, and the deduplication rule applied.
- The list of channels included in the denominator, and above all the ones excluded from it.
- The publication grain: per team and per channel, never per named person.
- The threshold below which a cut is not published, because a thin sample re-identifies people.
- The date of the reading, and whether or not the measurement will be run again identically next year.
Those six lines separate a barometer from a sales argument. They make the measurement repeatable, therefore comparable year over year, therefore citable by someone other than its author. A number published without them reads as a well presented opinion.
The protocol, on last week's data
Five steps are enough, and none of them requires an extra tool or a budget. What costs something is the discipline of fixing the conventions before the first query: a convention changed halfway through makes this year's measurement incomparable with next year's.
- Pick one team and four consecutive closed weeks. A single week gets flattened by one public holiday or two absences.
- Build the denominator channel by channel from the logs of the tools themselves: email, telephony, calendar, business messaging apps. Write down the channels you cannot observe, they are part of the result.
- Build the numerator from a CRM export over the same period and the same scope, keeping only interactions attached to a contact or a company.
- Apply the four conventions, then divide. Publish the rate channel by channel before any global rate, which always hides a channel sitting at zero.
- Compute the median delay between a conversation and its trace. A high rate with a three week median describes a CRM that gets filled before pipeline reviews, not a CRM that tracks activity.
The first run usually produces an uncomfortable number, and a discovery more useful than the number: the list of channels you cannot observe. That list drives the trade-offs long before any tool choice does.
The thesis this protocol puts to the test, the time lost to typing things in by hand, is argued at kasar.app/blog/stop-saisie-manuelle-crm with the market figures this article warns against mistaking for a measurement. The division above exists to check it in your own company rather than believe it, and what to do with a known rate is covered at kasar.app/guides/crm-pme-adoption.
Kasar is an AI-native CRM. Its agent, Leo, captures interactions across email, LinkedIn, WhatsApp, calendar and calls, and that coverage is detailed at kasar.app/features. The protocol above applies to it exactly as it applies to any other vendor: a number published without its six lines of method is worth no more, whatever logo sits next to it.
The day this percentage exists in your company, the conversation changes shape. You stop debating whether reps fill in the CRM, which is a matter of opinion and meeting time. You start debating a dated rate per channel, published with its method, that anyone on the team can recompute next month.
Frequently asked questions
Completeness is computed on what the CRM contains: the share of records whose required fields are filled. Capture rate is computed on what it does not contain: the share of conversations that actually happened and left a trace in it. Completeness can hit 100% in a database where half the conversations never arrived, because it only looks at the records that exist. Capture rate is the only one of the two whose denominator comes from outside the CRM.
Four consecutive closed weeks, outside holiday season and outside quarter end. A single week stays too sensitive to public holidays and absences to produce a stable number. A full quarter dilutes edge effects but costs more to reconstruct and delays the first decision. Running the measurement again at the same point next year matters more than the exact length of the window.
Count messages rather than threads, then publish the rate for those channels separately. A forty message negotiation and a four paragraph email do not compare, and mixing them into one global rate tilts the result toward the chattiest channel. The same caution applies to voice: a connected call counts as one interaction whatever its length, provided the threshold was set in advance, thirty seconds for instance.
No, which is why it is read channel by channel. A 40% rate on a marginal channel says very little, while the same 40% on a team's primary channel says that half the commercial history lives somewhere other than the tool meant to hold it. The number also has to be read against the value of the accounts involved. A low rate on support exchanges does not carry the cost of a low rate on accounts in active negotiation.
No. An export plus the logs of your communication tools are enough for the first calculation, and that is the point of the method. The tooling question arrives at the next step, when the list of channels you cannot observe includes one where part of your revenue is decided. That is a coverage trade-off rather than a feature trade-off, and it gets settled by comparing what each vendor publicly documents about its capture.
Ready to let Leo fill your CRM?
14-day free trial. Sell more, type less.
Try Kasar for freeRead next
Leaving HubSpot: export, remap, carry the history over
A HubSpot export hands you columns and identifiers, in three datasets that do not leave through the same door. What decides a migration is not the export, it is the mapping table and the order in which you run it.
Running your CRM from Claude or ChatGPT: what MCP breaks
An agent connected over MCP reads, writes and sends with equal ease, and the protocol does not tell those three moves apart. The line between what it does alone and what needs a confirmation is drawn inside the CRM server, not inside the protocol.